PPB Intro
The Bullet
The Patch
Loading PPBs
Shooting PPBs
Reading Patches
Hunting & the PPB
Testing Loads
The GD PPB
The GD PPB
Experiment
Weather and
Black Powder
Hunting & Range
Estimation
Making a Pistol Grip
Email:
brentd@iastate.edu
Testing Loads
When comparing loads we usually use group size as a measure of accuracy. In general, group size is very easy and convenient to use as a measure, but it lacks statistical rigor. As with most things, the most powerful statistical tool is hardly the most convenient so I have attempted to draw a compromise between convenience and a powerful method.
So, what is a powerful method? It is a procedure which provides the user with two things: First, a high degree of confidence that the differences between two treatments (e.g., accuracy of two different loads for a target rifle) are indeed real. And second, a high degree of confidence that finding "no statistical difference" means there is truly no difference between the two treatments.
Let's deal with the first part. If I shot a 10-shot group with an inexpensive .22 ammo like Wolf Match that was 1.25" at 100 yds and another group with Eley Tenex that was 1.125" should I really feel confident that Tenex is more accurate? Maybe. If it were doing the shooting you, would you confident enough to invest in a case of Tenex on the basis of just those two groups? Probably not. You would probably shoot another group or two with each ammo and see if Tenex continued to beat Wolf Match. If you, in fact, did this, then YOU ARE using statistics - not in the formal sense, but in the by-the-seat-of-your-pants-sense. Sometimes the seat-of-your-pants is good enough. Sometimes it is not. And wouldn't it be nice to know just how confident you can truly be before you plunk down the green for a brick or two of the Good Stuff? And if by chance you did not find much difference between Wolf Match and Tenex, and so chose Wolf, just how sure would you like to be that you have the right stuff when you throw down to shoot for the money against someone that has all the bells and whistles and knows how to use them?
Well as I mentioned, there are EASY ways, there are BEST ways, and there are ways in between. Before describing what I feel is the optimal the compromise, let me address the EASY and BEST ways and illustrate their up sides and down sides. If you want, skip through all this boring BS, just find the section that begins with "The 2-Shot Way"
The EASY Way is what most of us do and what you read about on the internet over and over. We shoot groups. Some of us believe in 3-shot groups, some in 5-shot groups. Some hard-core guys like no less than 10-shot groups and a few gun cranks are not happy with less than 20 or 30-shot groups. However it is done, it is easy. All you have to do is measure the longest distance across the bullet holes and you have a number. Do that for each of two or more loads and you are ready to make a decision. That is the upside - it is EASY.
The down side is that if you do this again, you might not get the same result. The load that had the slightly better result the first time, might have the worse result the second time. Then what? Do it again? How many times do you have to do it, before you are happy that you know which is best? How do you know if you should even BE happy in the first place? This is one of the two major down sides - No quantitative degree of happiness (more on measuring "happiness" later).
The second downside is that if you shoot a large number of shots, most of them will not go into the calculation of anything. Suppose you shoot 30 shots per group, what does it mean? It might mean that one or two of the shots that actually were part of the largest dimension of the group happened to be aberrant for some reason of which you are blissfully unaware. A bullet could have a void, or a primer might be bad, or a fluke breeze might have puffed up, or a particularly bad moment of mirage might have occurred, or any one of dozens of possibilities could have resulted in that one shot that goes just a little wider than all the rest. How do you know it is not a fluke totally unrelated to whatever it is that you are testing (e.g, two different powder charges)? The answer is you do no, you cannot, and you are only fooling yourself if you think you can always detect such "demonic" events, yet that one bad moment provides the only measure of accuracy for that entire group and all the other shots are effectively wasted. If you could somehow use ALL the shots you would at least dilute the bias caused by this anomaly and thus get a truer estimate of what is really happening out there.
So how can we use ALL the shots?
The answer is The BEST Way. So what is the best way? Effectively, I want to know how far the bullet falls from my point of aim. If the bullet hits exactly where I'm aiming then I have perfect accuracy - right? And every shot will be piled one on top of the other in the center of the x-ring - right? Well, yes, at least if my point of aim is perfect, and if I really know where exactly where the rifle is aiming (in other words the rifle is perfectly sighted in, and I have perfect form on the bench - hah!).
So, why not measure the distance between every bullet strike and the center of the target that I am aiming at? One reason is that my rifles are rarely exactly, perfectly, and without fail sighted in exactly on the center. An "easy" correction for that is to instead measure the exact distance between each shot and the center of the group instead of the center of the bull. No sweat. But where is the center of the group?
Two find the true center of the group, I could measure the horizontal and vertical distances of each shot from some fixed reference point, say the center of the target. If I then average the horizontal distances for all the shots and then average the vertical distances for all the shots, these two averages will give me an estimate of the geometric center of the group (that is the average horizontal and vertical distances will give me an estimate of where my rifle was really aimed relative to the reference point).
So, now I could use this new point (the center of the group), and I can then measure the distance of each shot from the center. For a 10-shot group, I could compute an average distance from the group. What could be better than that? Not much. But what do I do with this number?
What I want to do is to find the similar measure for another group with my other load and then I can compare these average distances. The more shots I have, the better off I am (more statistical power) and the more likely I will be to find a difference between the two loads if they are indeed different in accuracy.
So, how do I use these two numbers? First of all let's get some shorthand ways of referring to them. I'll call the average distance of each shot from the center of the group Xbar and Xbar1 will be that value for the first group and Xbar2 will be that number for the second group. But I need some more numbers as well. I need some measure of the variation in this number. The best measure of this variation is the variance which is computed as the squared difference of the distance of each shot from the group center when subtracted from the average distance of the shots from the center, all this divided by the number of shots - minus one (I won't go into why the minus one, just trust me, this is not controversial).
In arithmetical form, if Xi is the distance of the ith shot from the center of the group, and if we have n shots in the group then
[image]
and
[image]
and just for shorthand later on, I will need another measure of the variance for calculating a test statistic. This measure is the Standard Deviation and I will call it StDevX for short. It is just the square root of VarX or
[image]
Now with this I can come up with an Xbar1, Xbar2, StDev1, StDev2, n1, and n2
All this looks like a royal PITA to calculate doesn't it? Relax - Billy Gates made it easy for you. All of this can be done in an Excel spread sheet and most calculators as well. So this is no big deal. More on spreadsheet manipulations later.
So, I have everything I need. What next?
Well, so far, I really have not done statistics. I have computed a bunch of statistics in some sense but I have not done any statistics yet. Confusing I know. Bear with me.
Long ago - like about a century ago, a guy that was a quality control expert for Guinness Brewery needed to make tests similar to what we need to do. He wanted to compare averages values of some parameter measured from different batches of beer. He designed something he called a T-test. He could not publish it under his own name (WS Gossett) - Guinness would not let him, so he made up the name Student and his test is now known as Student's T-test. Using a T-test is really using statistics in the truest sense. It is a very simple method for comparing the averages of two treatments. The things being compared might be the average distances from the center of a group, average scores on a bunch of targets, average velocities from a string of shots over a chronograph, but the essence of this is that there are two groups of values and the experimenter wants to know if they differ.
Here is how it works.
The t-value for comparing two averages is computed as the following:
[image]
So what next? I want to use the t value to give me an indication of whether my two loads really differ. In fact, I'm really only interested in learning if Tenex (XBar1) is truly more accurate than Wolf Match (i.e., XBar MUST be less than XBar1 to even consider the possibility that Tenex is better). This is known as a one-tailed t-test. Maybe someday I will go into the details of how this differs from a two-tailed test, but trust me on this for now. After all, you aren't paying me tuition are you?
What the t-value tells me is: if the difference in the numerator (top half of the equation above) is positive but small relative to the variances in the denominator (bottom half of the equation), then perhaps the difference is not really real. It might be just a fluke, and I would be silly to trust that the differences are real. How much difference relative to those variances is enough? This is not trivial and I cannot reasonably explain it, and all the assumptions that go into how this is done, but Gossett created some tables that we can use to look this up. Those tables use the t-value I have computed and the numbers of shots in each group to give me a measure of how likely this result is to have occurred by chance given that the THE FIRST LOAD IS AT LEAST AS ACCURATE AS THE SECOND. This last phrase is called my null hypotheses, we don't often state it, but it is always there. Always. It becomes the bench mark from which we measure the likelihood of our results.
Using these values and the tables, I might find that the likelihood that my observed difference is very small under the assumption of the null hypothesis above. If it is very small (in my profession a probability of 5% or less is considered very small), I must reject the null hypothesis in favor of the alternative hypothesis, which in this case is that the average distance between each shot and the group's center is smallest for Tenex. That is, if the tables tell me that I would only observe such a difference 5 times or less out of 100 repetitions of this experiment if the ammos were indeed equal, then I am confident that Tenex is probably really better than Wolf Match.
Well, great. All you need is a table and a whole lotta spare time and YOU can do this too. But, in fact, you don't really need the table as Excel will compute the probability for you and this is all you are looking for. Without a doubt it is the best way to go statistically.
But, finally, here is the big downside. It is tedious beyond belief, even more tedious than typing all of this stuff. Making all the measurements, punching them into to the computer, etc, etc. It will bore you stiffer than a 3-day old cadaver. It is also hard to actually find the centers of the 10 shots to plot them effectively. I've tried this on some of Joe Harz's .22 targets that he sent me and I just couldn't swim through it all. Way way too boring.
So, if it is that bad, I will never convince any of you to use it. I cannot even convince myself. There has to be a better way and now I think I have found it. It will take far less time for you to actually use the alternative method than it will take for me to tell you about it.
Let's call it:
The 2-Shot Way
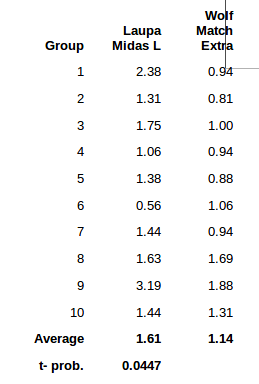
I think the best way to tell you how this works is by example, and here is a real-world example that I actually did this morning to really test whether Ely Tenex Ultimate EPS is indeed better than Wolf Match Extra in my rifle (a uniquely rebarreled Winchester Low Wall). I have already concluded with this same method, that Wolf Match Extra was better than top-of-the-line Lapua Midas L, and now I want to see if Eley's best could do better yet.
Here is what I did. I shot at 100 yds off the bench with front and rear bags. The rifle was fitted with a 25x Lyman STS scope. Conditions were flat dead calm and cool. Just about as perfect as I could hope for.
Because shooting lots of 2-shot groups takes lots of targets, I wanted something with a small bull so I could fit lots of them on the target frame. For this, I generally prefer ASSRA 50 ft targets with 6 bulls on them. But somewhere a large stack of these is sitting, lost for all time. So, instead, I used 10-meter air pistol targets. These provide an adequate aiming point using the 25x scope and I could fit 6 of them on each of two cardboard panels that I had. I started by sighting the rifle in and then fired 2 shots on each of 6 bulls with the Wolf ammo. Next, I fired 2 shots on the other 6 targets with the Tenex. I labeled and pulled all the targets and repeated the process to give me 12 targets of each. Is this the best way to get 12 targets for each ammo type? Probably not. Randomization of targets and ammo would be better in some small way, but convenience is important here if this is to be a usable technique.
The targets I measured with my digital calipers in just a few minutes. I measured these center to center distances:
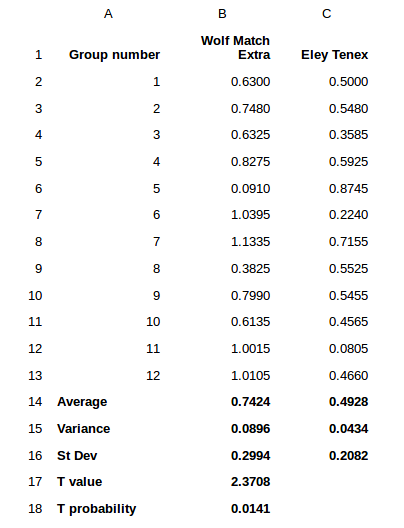
As you can see the Tenex groups were smaller, enough so that I was pretty sure that I would find a significant difference. But how confident am I? I'm 98.59% sure that Tenex beats Wolf. Where did the 98.59% come from? It is 1 minus the T probability expressed as a percentage. That is a pretty clear favorite in this case. In general, I want to be at least 90% sure that Tenex is better before I make the switch. In my profession, 95% is the gold standard, but each of you may have your own comfort zone. And in many cases, the differences might be quite a bit smaller and not so plainly obvious as they are here.
BTW, all of these numbers were crunched using Microsoft's Excel program. If you have not used Excel much, there are many shorthand methods for all doing this and I have listed the formulas below. Note that the columns are labeled A, B, C and the rows are numbered 1 through 18 in this spreadsheet. All the numbers in bold are actually calculated by Excel which makes all of this very easy.
So, for example, the average for Wolf is computed by typing the following script into the cell showing 0.7424:
=ave(B2..B13)
The variance for Wolf is computed by typing
= var(B2..B13) into the cell B15
The Standard Deviation is computed with the formula
=stdev(B2..B13)
The T value is really computed just for you to see the value. Excel will compute the probability, which is what we are really after, directly in a series of behind the scenes calculations that we don't need to worry about but I did this anyway, just to give you an idea of what we are looking for.
Finally the probability that the two ammunitions have the same accuracy is computed by the following formula
= ttest(B2..B12,C2..C12,1,3)
in cell B18.
In fact, this is really the only number you need to calculate at all. The average, STD etc, are all computed just for you to see. When you use Excel's ttest function, all these numbers are calculated behind the scenes where you do not see them, but they are there nonetheless. In any event, we can see that Excel uses all of our group data plus two other coded numbers. The last two numbers, 1 and 3, refer to the particular version of the t-test that we are using. Did I tell you that there are many different flavors of the T-test for certain special conditions? There are. The one refers to a one-tailed test - which we are using here because I am only interested in determining if Tenex is better than my previous preferred ammo, Wolf. And the 3 refers to the two samples having unequal variances (i.e., they are heteroscedastic). I could assume the same underlying variance structure here (coded with a 2 instead of the 3) but I did not for some reasons that I prefer not to dwell on. If I did, you would fall asleep and possibly hit your head on the keyboard, resulting in a liability lawsuit against me and the maker of your keyboard. I cannot risk that.
Here is another earlier example that I did with Lapua Midas L. Here, I am 95.53% certain that Wolf is better than Lapua.
What the hell is this all about?
Okay, so now you have the technique, but conceptually, what are we trying to do here? I saved this for last because, well because. If I was writing a text book and you were paying for it, I would probably have this section as a full chapter in the very beginning. Send me enough royalties and I'll revise it in the next edition.
Anyway, here is what we are trying to do. We have a measure of accuracy - in my case, it is 2-shot groups. It could be string measure, it could be average distance of each shot from the center of the groups, it could be a bunch of things. But I chose 2-shot groups for all the reasons mentioned above. If I make enough measures of accuracy with each load, I might expect to see both an average measure of group size for a given ammo and a "bell shaped curve" around that average (better called the mean, btw). If you look at the first graph above, you see two such bell curves, one for each brand of ammo. The widths of these bell curves are important. The variance is what governs the widths. Variance, remember, happens to be the square of the Standard Deviation, so Standard Deviation (of which you have all heard, is just as good a measure of the width of the bell curve). You might notice that there is a lot of overlap in these two curves. This signifies that often (proportional to the area under the curve), the blue curve's measure will meet or exceed the red curve's measure. But most of the time, the reverse it true.
Now, if the variances (and standard deviations) of those curves were smaller, you might expect to see narrower bell curves, as in the second graph. You might well guess that it will be a lot easier to tell that the average for the blue curve is less than the average for the red curve when this is the case, even though the actual difference in the averages is exactly the same as it is in the first graph. Less overlap suggests that red will produce a higher average than blue more often when the variances are smaller.
What I want to know is how the means differ (labeled X1 and X2 in the figures). And the T-test is one very good way to do that. It uses the variances and the averages and also the sample sizes (numbers of groups shot with each ammo), to produce this estimate of the degree of confidence that you have two different means.
So, what is a powerful method? It is a procedure which provides the user with two things: First, a high degree of confidence that the differences between two treatments (e.g., accuracy of two different loads for a target rifle) are indeed real. And second, a high degree of confidence that finding "no statistical difference" means there is truly no difference between the two treatments.
Let's deal with the first part. If I shot a 10-shot group with an inexpensive .22 ammo like Wolf Match that was 1.25" at 100 yds and another group with Eley Tenex that was 1.125" should I really feel confident that Tenex is more accurate? Maybe. If it were doing the shooting you, would you confident enough to invest in a case of Tenex on the basis of just those two groups? Probably not. You would probably shoot another group or two with each ammo and see if Tenex continued to beat Wolf Match. If you, in fact, did this, then YOU ARE using statistics - not in the formal sense, but in the by-the-seat-of-your-pants-sense. Sometimes the seat-of-your-pants is good enough. Sometimes it is not. And wouldn't it be nice to know just how confident you can truly be before you plunk down the green for a brick or two of the Good Stuff? And if by chance you did not find much difference between Wolf Match and Tenex, and so chose Wolf, just how sure would you like to be that you have the right stuff when you throw down to shoot for the money against someone that has all the bells and whistles and knows how to use them?
Well as I mentioned, there are EASY ways, there are BEST ways, and there are ways in between. Before describing what I feel is the optimal the compromise, let me address the EASY and BEST ways and illustrate their up sides and down sides. If you want, skip through all this boring BS, just find the section that begins with "The 2-Shot Way"
The EASY Way is what most of us do and what you read about on the internet over and over. We shoot groups. Some of us believe in 3-shot groups, some in 5-shot groups. Some hard-core guys like no less than 10-shot groups and a few gun cranks are not happy with less than 20 or 30-shot groups. However it is done, it is easy. All you have to do is measure the longest distance across the bullet holes and you have a number. Do that for each of two or more loads and you are ready to make a decision. That is the upside - it is EASY.
The down side is that if you do this again, you might not get the same result. The load that had the slightly better result the first time, might have the worse result the second time. Then what? Do it again? How many times do you have to do it, before you are happy that you know which is best? How do you know if you should even BE happy in the first place? This is one of the two major down sides - No quantitative degree of happiness (more on measuring "happiness" later).
The second downside is that if you shoot a large number of shots, most of them will not go into the calculation of anything. Suppose you shoot 30 shots per group, what does it mean? It might mean that one or two of the shots that actually were part of the largest dimension of the group happened to be aberrant for some reason of which you are blissfully unaware. A bullet could have a void, or a primer might be bad, or a fluke breeze might have puffed up, or a particularly bad moment of mirage might have occurred, or any one of dozens of possibilities could have resulted in that one shot that goes just a little wider than all the rest. How do you know it is not a fluke totally unrelated to whatever it is that you are testing (e.g, two different powder charges)? The answer is you do no, you cannot, and you are only fooling yourself if you think you can always detect such "demonic" events, yet that one bad moment provides the only measure of accuracy for that entire group and all the other shots are effectively wasted. If you could somehow use ALL the shots you would at least dilute the bias caused by this anomaly and thus get a truer estimate of what is really happening out there.
So how can we use ALL the shots?
The answer is The BEST Way. So what is the best way? Effectively, I want to know how far the bullet falls from my point of aim. If the bullet hits exactly where I'm aiming then I have perfect accuracy - right? And every shot will be piled one on top of the other in the center of the x-ring - right? Well, yes, at least if my point of aim is perfect, and if I really know where exactly where the rifle is aiming (in other words the rifle is perfectly sighted in, and I have perfect form on the bench - hah!).
So, why not measure the distance between every bullet strike and the center of the target that I am aiming at? One reason is that my rifles are rarely exactly, perfectly, and without fail sighted in exactly on the center. An "easy" correction for that is to instead measure the exact distance between each shot and the center of the group instead of the center of the bull. No sweat. But where is the center of the group?
Two find the true center of the group, I could measure the horizontal and vertical distances of each shot from some fixed reference point, say the center of the target. If I then average the horizontal distances for all the shots and then average the vertical distances for all the shots, these two averages will give me an estimate of the geometric center of the group (that is the average horizontal and vertical distances will give me an estimate of where my rifle was really aimed relative to the reference point).
So, now I could use this new point (the center of the group), and I can then measure the distance of each shot from the center. For a 10-shot group, I could compute an average distance from the group. What could be better than that? Not much. But what do I do with this number?
What I want to do is to find the similar measure for another group with my other load and then I can compare these average distances. The more shots I have, the better off I am (more statistical power) and the more likely I will be to find a difference between the two loads if they are indeed different in accuracy.
So, how do I use these two numbers? First of all let's get some shorthand ways of referring to them. I'll call the average distance of each shot from the center of the group Xbar and Xbar1 will be that value for the first group and Xbar2 will be that number for the second group. But I need some more numbers as well. I need some measure of the variation in this number. The best measure of this variation is the variance which is computed as the squared difference of the distance of each shot from the group center when subtracted from the average distance of the shots from the center, all this divided by the number of shots - minus one (I won't go into why the minus one, just trust me, this is not controversial).
In arithmetical form, if Xi is the distance of the ith shot from the center of the group, and if we have n shots in the group then
[image]
and
[image]
and just for shorthand later on, I will need another measure of the variance for calculating a test statistic. This measure is the Standard Deviation and I will call it StDevX for short. It is just the square root of VarX or
[image]
Now with this I can come up with an Xbar1, Xbar2, StDev1, StDev2, n1, and n2
All this looks like a royal PITA to calculate doesn't it? Relax - Billy Gates made it easy for you. All of this can be done in an Excel spread sheet and most calculators as well. So this is no big deal. More on spreadsheet manipulations later.
So, I have everything I need. What next?
Well, so far, I really have not done statistics. I have computed a bunch of statistics in some sense but I have not done any statistics yet. Confusing I know. Bear with me.
Long ago - like about a century ago, a guy that was a quality control expert for Guinness Brewery needed to make tests similar to what we need to do. He wanted to compare averages values of some parameter measured from different batches of beer. He designed something he called a T-test. He could not publish it under his own name (WS Gossett) - Guinness would not let him, so he made up the name Student and his test is now known as Student's T-test. Using a T-test is really using statistics in the truest sense. It is a very simple method for comparing the averages of two treatments. The things being compared might be the average distances from the center of a group, average scores on a bunch of targets, average velocities from a string of shots over a chronograph, but the essence of this is that there are two groups of values and the experimenter wants to know if they differ.
Here is how it works.
The t-value for comparing two averages is computed as the following:
[image]
So what next? I want to use the t value to give me an indication of whether my two loads really differ. In fact, I'm really only interested in learning if Tenex (XBar1) is truly more accurate than Wolf Match (i.e., XBar MUST be less than XBar1 to even consider the possibility that Tenex is better). This is known as a one-tailed t-test. Maybe someday I will go into the details of how this differs from a two-tailed test, but trust me on this for now. After all, you aren't paying me tuition are you?
What the t-value tells me is: if the difference in the numerator (top half of the equation above) is positive but small relative to the variances in the denominator (bottom half of the equation), then perhaps the difference is not really real. It might be just a fluke, and I would be silly to trust that the differences are real. How much difference relative to those variances is enough? This is not trivial and I cannot reasonably explain it, and all the assumptions that go into how this is done, but Gossett created some tables that we can use to look this up. Those tables use the t-value I have computed and the numbers of shots in each group to give me a measure of how likely this result is to have occurred by chance given that the THE FIRST LOAD IS AT LEAST AS ACCURATE AS THE SECOND. This last phrase is called my null hypotheses, we don't often state it, but it is always there. Always. It becomes the bench mark from which we measure the likelihood of our results.
Using these values and the tables, I might find that the likelihood that my observed difference is very small under the assumption of the null hypothesis above. If it is very small (in my profession a probability of 5% or less is considered very small), I must reject the null hypothesis in favor of the alternative hypothesis, which in this case is that the average distance between each shot and the group's center is smallest for Tenex. That is, if the tables tell me that I would only observe such a difference 5 times or less out of 100 repetitions of this experiment if the ammos were indeed equal, then I am confident that Tenex is probably really better than Wolf Match.
Well, great. All you need is a table and a whole lotta spare time and YOU can do this too. But, in fact, you don't really need the table as Excel will compute the probability for you and this is all you are looking for. Without a doubt it is the best way to go statistically.
But, finally, here is the big downside. It is tedious beyond belief, even more tedious than typing all of this stuff. Making all the measurements, punching them into to the computer, etc, etc. It will bore you stiffer than a 3-day old cadaver. It is also hard to actually find the centers of the 10 shots to plot them effectively. I've tried this on some of Joe Harz's .22 targets that he sent me and I just couldn't swim through it all. Way way too boring.
So, if it is that bad, I will never convince any of you to use it. I cannot even convince myself. There has to be a better way and now I think I have found it. It will take far less time for you to actually use the alternative method than it will take for me to tell you about it.
Let's call it:
The 2-Shot Way
I think the best way to tell you how this works is by example, and here is a real-world example that I actually did this morning to really test whether Ely Tenex Ultimate EPS is indeed better than Wolf Match Extra in my rifle (a uniquely rebarreled Winchester Low Wall). I have already concluded with this same method, that Wolf Match Extra was better than top-of-the-line Lapua Midas L, and now I want to see if Eley's best could do better yet.
Here is what I did. I shot at 100 yds off the bench with front and rear bags. The rifle was fitted with a 25x Lyman STS scope. Conditions were flat dead calm and cool. Just about as perfect as I could hope for.
Because shooting lots of 2-shot groups takes lots of targets, I wanted something with a small bull so I could fit lots of them on the target frame. For this, I generally prefer ASSRA 50 ft targets with 6 bulls on them. But somewhere a large stack of these is sitting, lost for all time. So, instead, I used 10-meter air pistol targets. These provide an adequate aiming point using the 25x scope and I could fit 6 of them on each of two cardboard panels that I had. I started by sighting the rifle in and then fired 2 shots on each of 6 bulls with the Wolf ammo. Next, I fired 2 shots on the other 6 targets with the Tenex. I labeled and pulled all the targets and repeated the process to give me 12 targets of each. Is this the best way to get 12 targets for each ammo type? Probably not. Randomization of targets and ammo would be better in some small way, but convenience is important here if this is to be a usable technique.
The targets I measured with my digital calipers in just a few minutes. I measured these center to center distances:
As you can see the Tenex groups were smaller, enough so that I was pretty sure that I would find a significant difference. But how confident am I? I'm 98.59% sure that Tenex beats Wolf. Where did the 98.59% come from? It is 1 minus the T probability expressed as a percentage. That is a pretty clear favorite in this case. In general, I want to be at least 90% sure that Tenex is better before I make the switch. In my profession, 95% is the gold standard, but each of you may have your own comfort zone. And in many cases, the differences might be quite a bit smaller and not so plainly obvious as they are here.
BTW, all of these numbers were crunched using Microsoft's Excel program. If you have not used Excel much, there are many shorthand methods for all doing this and I have listed the formulas below. Note that the columns are labeled A, B, C and the rows are numbered 1 through 18 in this spreadsheet. All the numbers in bold are actually calculated by Excel which makes all of this very easy.
So, for example, the average for Wolf is computed by typing the following script into the cell showing 0.7424:
=ave(B2..B13)
The variance for Wolf is computed by typing
= var(B2..B13) into the cell B15
The Standard Deviation is computed with the formula
=stdev(B2..B13)
The T value is really computed just for you to see the value. Excel will compute the probability, which is what we are really after, directly in a series of behind the scenes calculations that we don't need to worry about but I did this anyway, just to give you an idea of what we are looking for.
Finally the probability that the two ammunitions have the same accuracy is computed by the following formula
= ttest(B2..B12,C2..C12,1,3)
in cell B18.
In fact, this is really the only number you need to calculate at all. The average, STD etc, are all computed just for you to see. When you use Excel's ttest function, all these numbers are calculated behind the scenes where you do not see them, but they are there nonetheless. In any event, we can see that Excel uses all of our group data plus two other coded numbers. The last two numbers, 1 and 3, refer to the particular version of the t-test that we are using. Did I tell you that there are many different flavors of the T-test for certain special conditions? There are. The one refers to a one-tailed test - which we are using here because I am only interested in determining if Tenex is better than my previous preferred ammo, Wolf. And the 3 refers to the two samples having unequal variances (i.e., they are heteroscedastic). I could assume the same underlying variance structure here (coded with a 2 instead of the 3) but I did not for some reasons that I prefer not to dwell on. If I did, you would fall asleep and possibly hit your head on the keyboard, resulting in a liability lawsuit against me and the maker of your keyboard. I cannot risk that.
Here is another earlier example that I did with Lapua Midas L. Here, I am 95.53% certain that Wolf is better than Lapua.
What the hell is this all about?
Okay, so now you have the technique, but conceptually, what are we trying to do here? I saved this for last because, well because. If I was writing a text book and you were paying for it, I would probably have this section as a full chapter in the very beginning. Send me enough royalties and I'll revise it in the next edition.
Anyway, here is what we are trying to do. We have a measure of accuracy - in my case, it is 2-shot groups. It could be string measure, it could be average distance of each shot from the center of the groups, it could be a bunch of things. But I chose 2-shot groups for all the reasons mentioned above. If I make enough measures of accuracy with each load, I might expect to see both an average measure of group size for a given ammo and a "bell shaped curve" around that average (better called the mean, btw). If you look at the first graph above, you see two such bell curves, one for each brand of ammo. The widths of these bell curves are important. The variance is what governs the widths. Variance, remember, happens to be the square of the Standard Deviation, so Standard Deviation (of which you have all heard, is just as good a measure of the width of the bell curve). You might notice that there is a lot of overlap in these two curves. This signifies that often (proportional to the area under the curve), the blue curve's measure will meet or exceed the red curve's measure. But most of the time, the reverse it true.
Now, if the variances (and standard deviations) of those curves were smaller, you might expect to see narrower bell curves, as in the second graph. You might well guess that it will be a lot easier to tell that the average for the blue curve is less than the average for the red curve when this is the case, even though the actual difference in the averages is exactly the same as it is in the first graph. Less overlap suggests that red will produce a higher average than blue more often when the variances are smaller.
What I want to know is how the means differ (labeled X1 and X2 in the figures). And the T-test is one very good way to do that. It uses the variances and the averages and also the sample sizes (numbers of groups shot with each ammo), to produce this estimate of the degree of confidence that you have two different means.